Author: Jessica Rodrigues
Author’s institution: University of Missouri
Journal: Educational Researcher (2021) [Closed Access]
Let’s pretend that we all don’t spend too much time online. If that were the case, I’d tell you about this thing called social media that allows individuals to share their thoughts with people around the globe. Even though social media is geared towards speed and simplicity, some scholars use it to share research findings. In the case of this one platform, Twitter, other scholars have found posting about research articles can increase article views and downloads of the actual article and may even increase citations.
Because many of us do spend too much time online, it probably doesn’t require much convincing to say that not all content is created equal. Simply posting the article and a link doesn’t create much engagement. Instead, a compelling social media post requires a mix of catchy text and appealing visuals. That’s why creating visual summaries of research articles is starting to gain traction in education.
Visual Abstracts
One specific example is visual abstracts. Visual abstracts are very similar to traditional textual abstracts except that the main information is presented in a graphic rather than a paragraph. Because the information is similar to the traditional abstract, this approach is used to complement existing information in the article and is aimed at other researchers. While intended for social media or the journal itself if it allows visual abstracts, visual abstracts also work as a summary slide in presentations.
To create a visual abstract, the author of today’s article lays out a 6-step procedure:
- Step 0: Select a design software that allows you to create images. PowerPoint, Google Slides, Keynote, and Canva all work here as do more advanced tools like Illustrator.
- Step 1: Determine the study design, describe the participants and methods, and define 2-3 key takeaways you want to communicate about the chosen research article.
- Step 2: Break the visual abstract into sections based on what you are trying to communicate. For example, if there are 3 takeaways, consider dividing the graphic abstract into three sections.
- Step 3: Add the article title, the author’s name, and the journal name to the graphic. Because the target of this abstract is researchers, they need to be able to find the full paper.
- Step 4: Use short phrases to summarize the key points laid out in the step 1.
- Step 5: Add relevant numbers or statistics to the abstract (e.g., sample size, p-values, effect size, etc.). What numbers you include depends on what your takeaways are.
- Step 6: Identify visual elements to communicate the key ideas from steps 4 and 5. Can you represent who participated in the study with an image or graphic? Can the results be presented with an image rather than a sentence? For creating graphics, many design programs have built-in icon libraries to help you out. Free databases like IconsDB (my personal go-to) as well as paid services can also be useful for expressing your ideas pictorially.
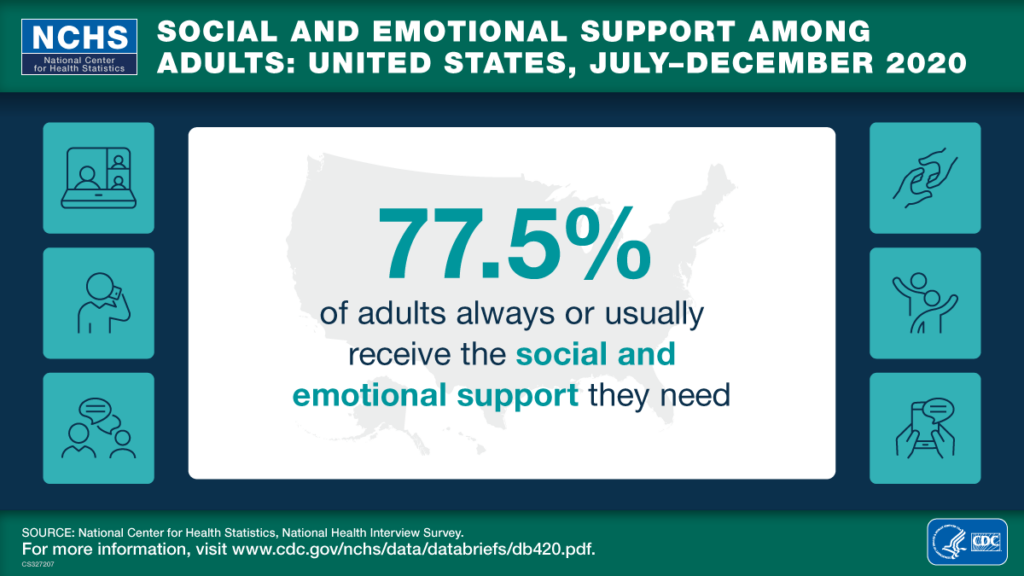
Translational Visual Abstracts
That approach works well if the intended audience is other researchers, but what if the goal is to instead reach nonscientists. As education researchers, we might be looking to reach parents, teachers, administrators, or policymakers. That’s where translational visual abstracts come in. They follow a similar structure as the visual abstracts but make a few changes. Most importantly, translational abstracts are tailored the specific audience of interest (a visual abstract is then a special case of the translational visual abstract where the intended audience is other researchers).
To make a translational abstract, the author of today’s article again provides a 6-step process:
- Step 1: Determine the audience and who the abstract is targeted towards.
- Step 2: Describe the participants in the study at the level that your audience will care about. For example, if you are trying to reach high school teachers about a study of high school students, then that the study is about high school students is important information. Try not to get bogged down in the details!
- Step 3: Consider what information in the scientific abstract and main paper needs to be included and what can be omitted. While the information is important, the amount of nuance that can be included in a translational visual abstract is limited and only the most important information can be included.
- Step 4: Describe the findings and the big takeaway. When describing the findings, make sure to use language that the audience will be able to understand. That means statistical significance, effect size, etc. are likely off the table. Instead, the focus on the message. Did one intervention work better than the control, was a new issue uncovered, etc.?
- Step 5: Provide a take-home message. This builds off the findings. As a result of the findings, what does the audience need to do or think now.
- Step 6: Include a citation to the paper or a link to the journal for folks to learn more. Remember that the primary purpose of the translational visual abstract is to translate the key messages, not to direct eyes to the original article.
Finally, when creating the translational visual abstract, the author recommends adapting it for each different audience and for each platform you intend to share it on. Therefore, you might have different translational visual abstracts for Facebook and Twitter even if they are about the same research paper.
Next Steps
Even though visual abstracts are still relatively new, they are beginning to catch on. The author urges education researchers to try a visual abstract. She also encourages anyone who does make a visual abstract to post it to Twitter using the hashtag #EdVisualAbstract.
I am a postdoc in education data science at the University of Michigan and the founder of PERbites. I’m interested in applying data science techniques to analyze educational datasets and improve higher education for all students