


Title: Design and validation of a test for representational fluency of 9th grade students in physics and mathematics: The case of linear functions
Authors: Stijin Ceuppens, Johan Deprez, Wim Dehaene, Mieke De Cock
First author’s institution: Katholieke Universiteit Leuven (English: Catholic University of Leuven)
Journal: Physical Review Physics Education Research 14 020105 (2018)
It probably comes as no surprise that math and physics are deeply linked. Sometimes math is even called the language of physics since solving physics problems and discovering new physics requires mathematics. Therefore, looking at students’ knowledge of mathematics is often important to understanding their knowledge of physics.
However, solving physics problems is more than just knowing the relevant physics knowledge and the relevant mathematics knowledge. For example, previous work has shown that having the mathematical skills to solve a problem is not sufficient for actually solving the problem. Other work has shown that the context matters, suggesting that students may be more likely to solve a math problem correctly than an identical problem with a physics context but otherwise the same mathematical solution. These studies all suggest that the interplay of math and physics may be just as important as knowledge of math and knowledge of physics by themselves.
In addition, how the problem is represented can also be important for how well a student can solve a problem. Since previous work has shown students are better at using some representations than others, students need the ability to switch from a less convenient representation to a more convenient one, which the authors of today’s paper call representational fluency. Representational fluency also captures the student’s ability to interpret and construct the representations. Today’s paper looks at representational fluency in both mathematical and physical contexts and tries to determine if this fluency is different between the two contexts.
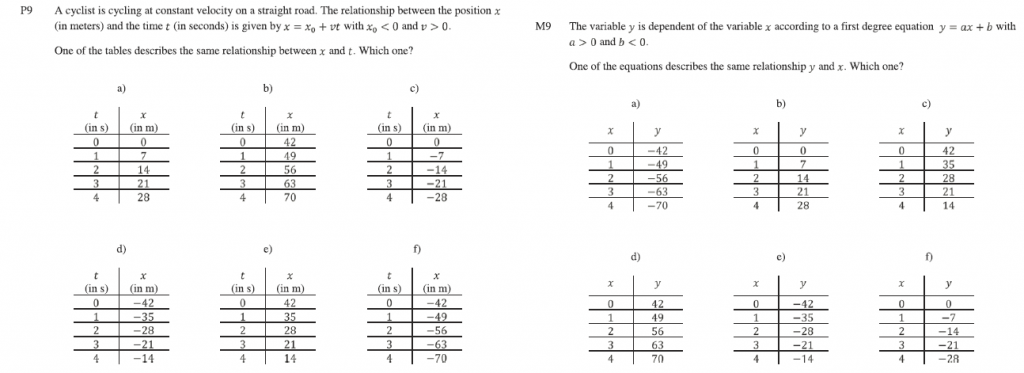
So what exactly does this mean in less jargony terms? First, the authors want to see how well students can transition between multiple representations of the same thing (representational fluency). For this study, that “thing” was linear functions which can be represented as graphs, tables, or algebraic functions. An example showing an identical function in the three representations is shown in figure 1.


Second, the authors want to compare how students answer mathematics word problems and physics word problems that are identical in their mathematical solutions but differ in the context (pure mathematics or 1D kinematics). Examples of these identical questions are shown in figure 2.


To do the study, the authors created a 48 item test, where half of the test used a mathematical context and the other half of the test used a 1D kinematics context. The authors then included 8 questions (4 on each half) to test each of the transitions between representations (graphs to table, table to graph, table to equation, etc.). Since linear functions have two parameters that can be adjusted (the slope and the y-intercept) the authors varied the appearance of the function to see if different choices of parameters changed the difficulty of the question. For example, maybe a question involving a function with a negative slope and positive y-intercept would be more difficult than a question with a positive slope and a negative y-intercept.
The researchers then gave the test to 385 9th grade students in Flanders, Belgium. The test was administered online and half of the students answered the math questions first and the other half answered the physics questions first. The results were then analyzed with generalized estimating equations (GEE) to determine how the physical context, the parameters of the linear function in the question, the representations used, and the gender of the students influence how many students answer the question correctly.
So what did they find? First, transitions between tables and graphs are the easiest for students to do, with around 87% of students able to correctly transition between these representations. Transitioning between anything that involved a formula was more challenging as only 62% of students could correctly transition between graphs and formulas and only 57% of students could correctly transition between tables and equations. Second, the percentage of students who can make a transition between representations is not related to the direction of the transition. Thus, if a student can create a table from an equation, they can also create an equation from a table. Third the researchers found that students did perform better on the questions with a mathematical context (72% correct) than the questions with a kinematics context (69% correct). Finally, the researchers found that if a student answered a question incorrectly, the most common reason was that the student switched the sign on the y-intercept and slope (question asks for positive slope and negative y-intercept but student selects answer with positive y-intercept and negative slope) or only switched the sign of the slope (asks for negative slope but student selects answer with positive slope). In general, questions with negative slopes or y-intercepts were more challenging for the student.
Since the researchers analyzed their data with GEE, they could also look at interactions between variables used in the study. For example, as shown in figure 3, the researchers found an interaction between the tabular and algebraic representations and the linear functions with no intercept but a positive slope. This means that the transition was not symmetric: students do better on transitioning from equations to tables than from tables to equations if the function used has a positive slope but not a y-intercept (y=3x for example).


When exploring this interaction further, the researchers found that this difference in performance was mainly driven by mathematical context questions rather than physics questions (figure 4).


A similar interaction was also found along gender lines when looking at transitions between equations and graphs for functions with a positive slope but without a y-intercept. Interestingly, only males show an asymmetry here, being better at transitions from equations to graphs than transitioning from graphs to equations when the question was posed in a mathematical context.
After presenting their findings, the authors suggest ways to apply these findings in the classroom. First, they suggest that the instructor or a software program could do the work of transition between representations so that students could instead focus on how one representation changes if another is changed without having to do the difficult transition for themselves. For example, a student could change the position of a line on a graph and see how the corresponding equation also changes. In terms of a more “physicsy” context, the instructor could generate uniform linear motion graphs with the use of a motion sensor and have the student practice matching the curve to a linear function and then have the student use the table to check that the function makes sense by plugging in values.
So what can we take away from this paper? First, while students can easily transition between graphs and tables, they have a hard time transitioning between representations if one of the representations is an equation. Second, students correctly answer questions without negative signs in the y-intercept or slope at a higher rate than questions with at least one of the quantities being negative. Finally, efforts to improve student’s ability to understand the relations between the multiple representations should avoid having the students directly translate between the representations.
A copy of the test used here is provided in the supplemental material. Details about the creation and validation of the test can be found in the paper.
Figures used under Creative Commons Attribution 4.0 International license.


I am a postdoc in education data science at the University of Michigan and the founder of PERbites. I’m interested in applying data science techniques to analyze educational datasets and improve higher education for all students